Categories
How To Monitor Azure VM Through Grafana
How To Monitor Azure VM Through Grafana
First we need to install Grafana Enterprise Locally
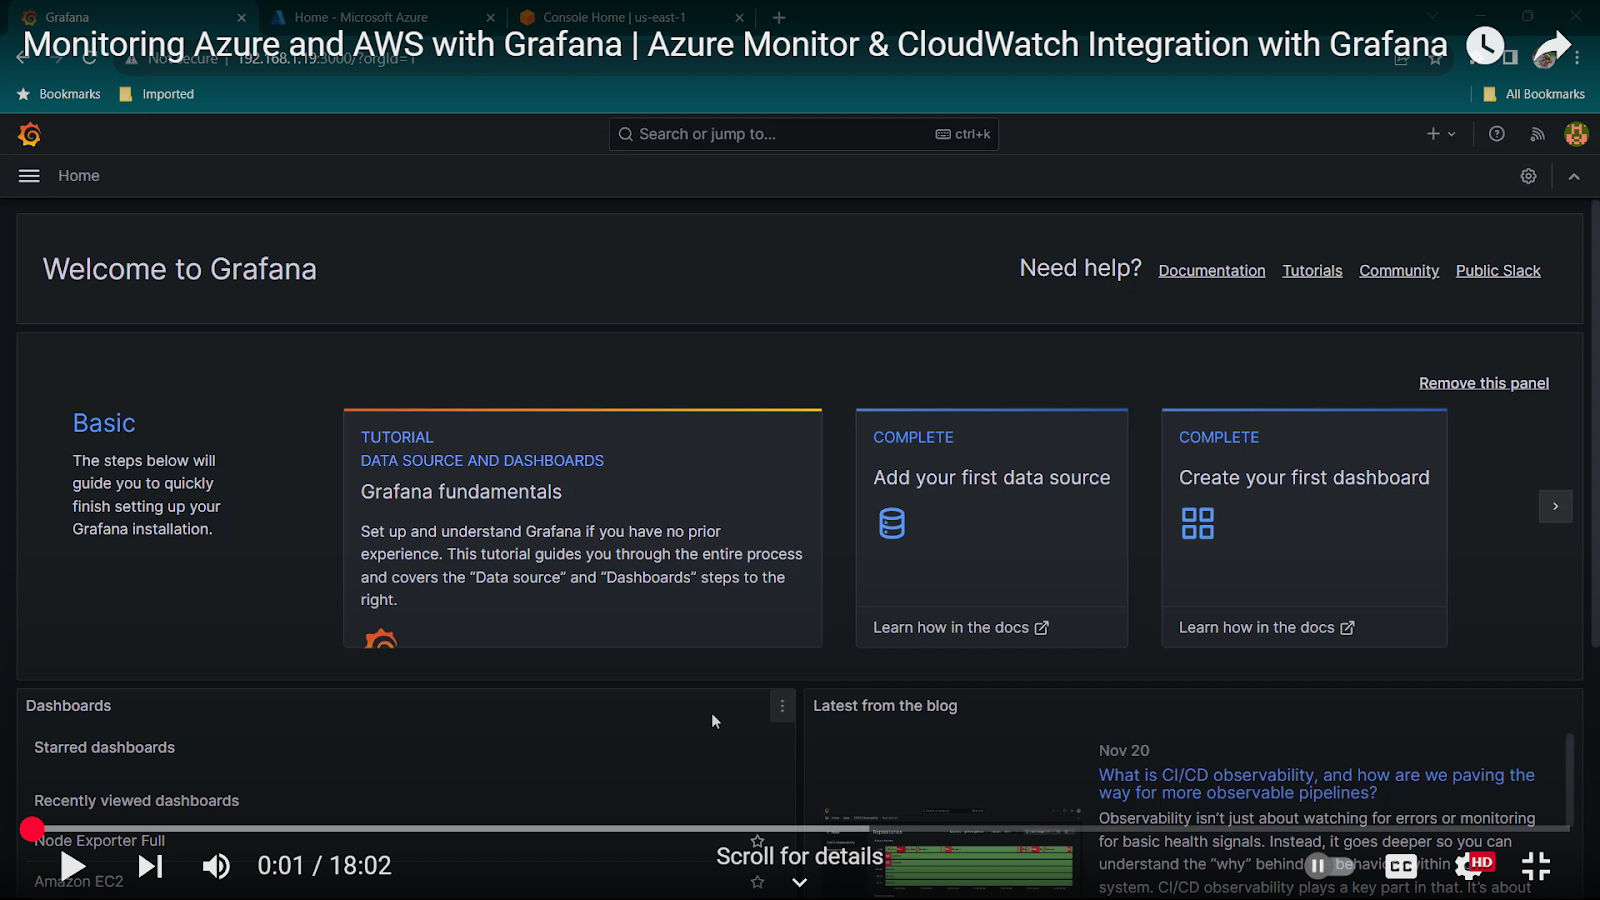
Next, open http://localhost:3000 and login by entering default username and password- “admin”
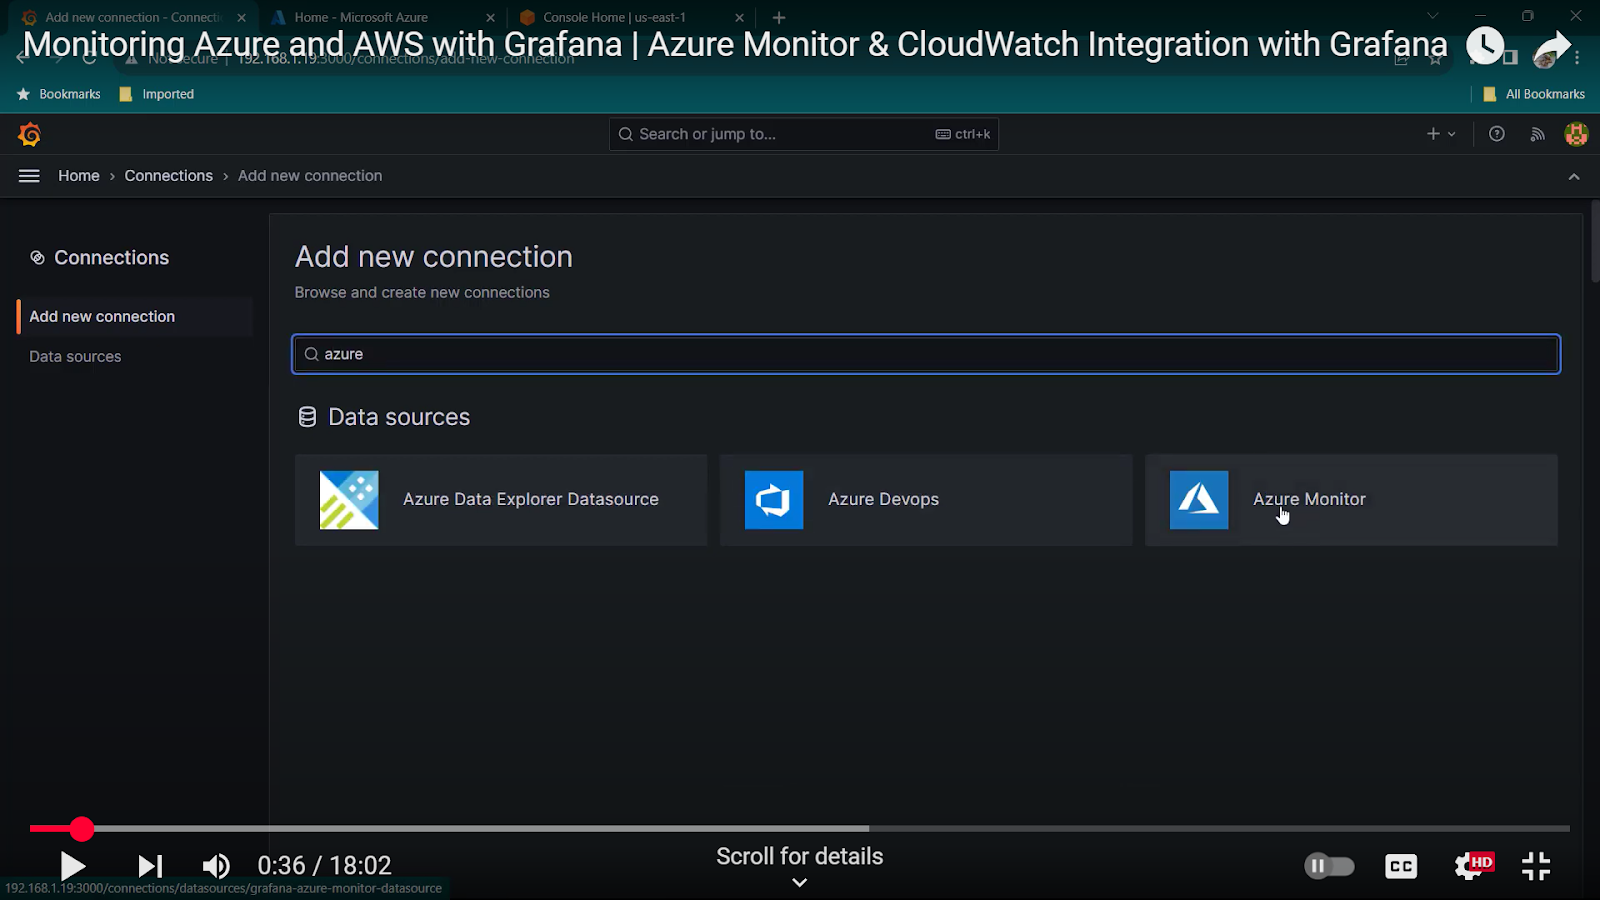
Click on 3 lines and go to connections-> Add new connections-> search for azure monitor and clock on it.
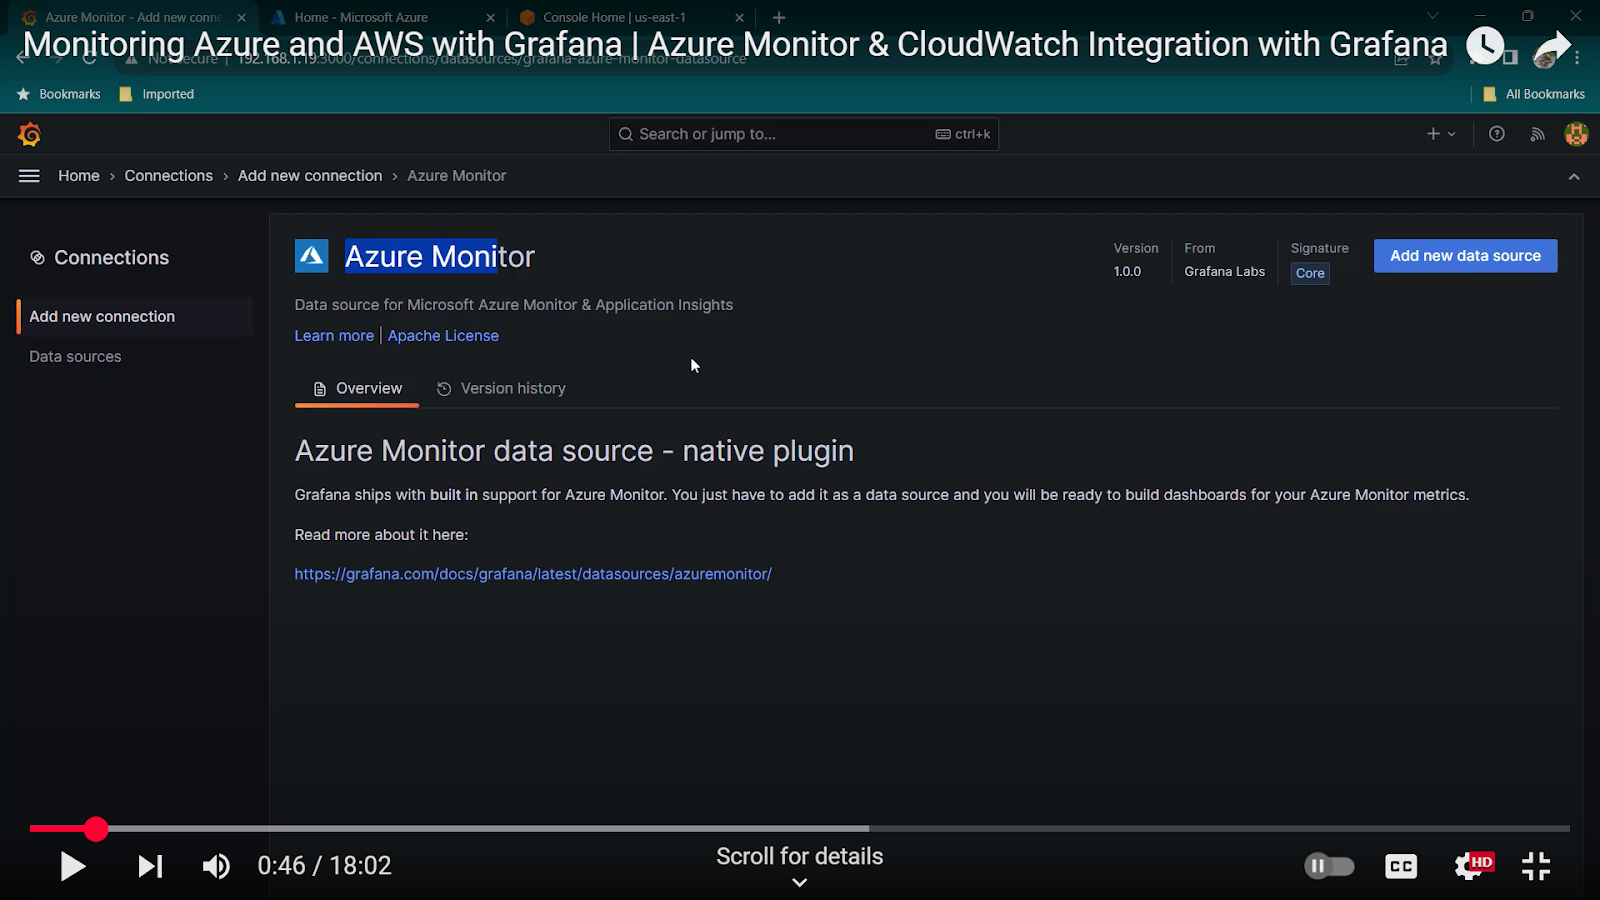
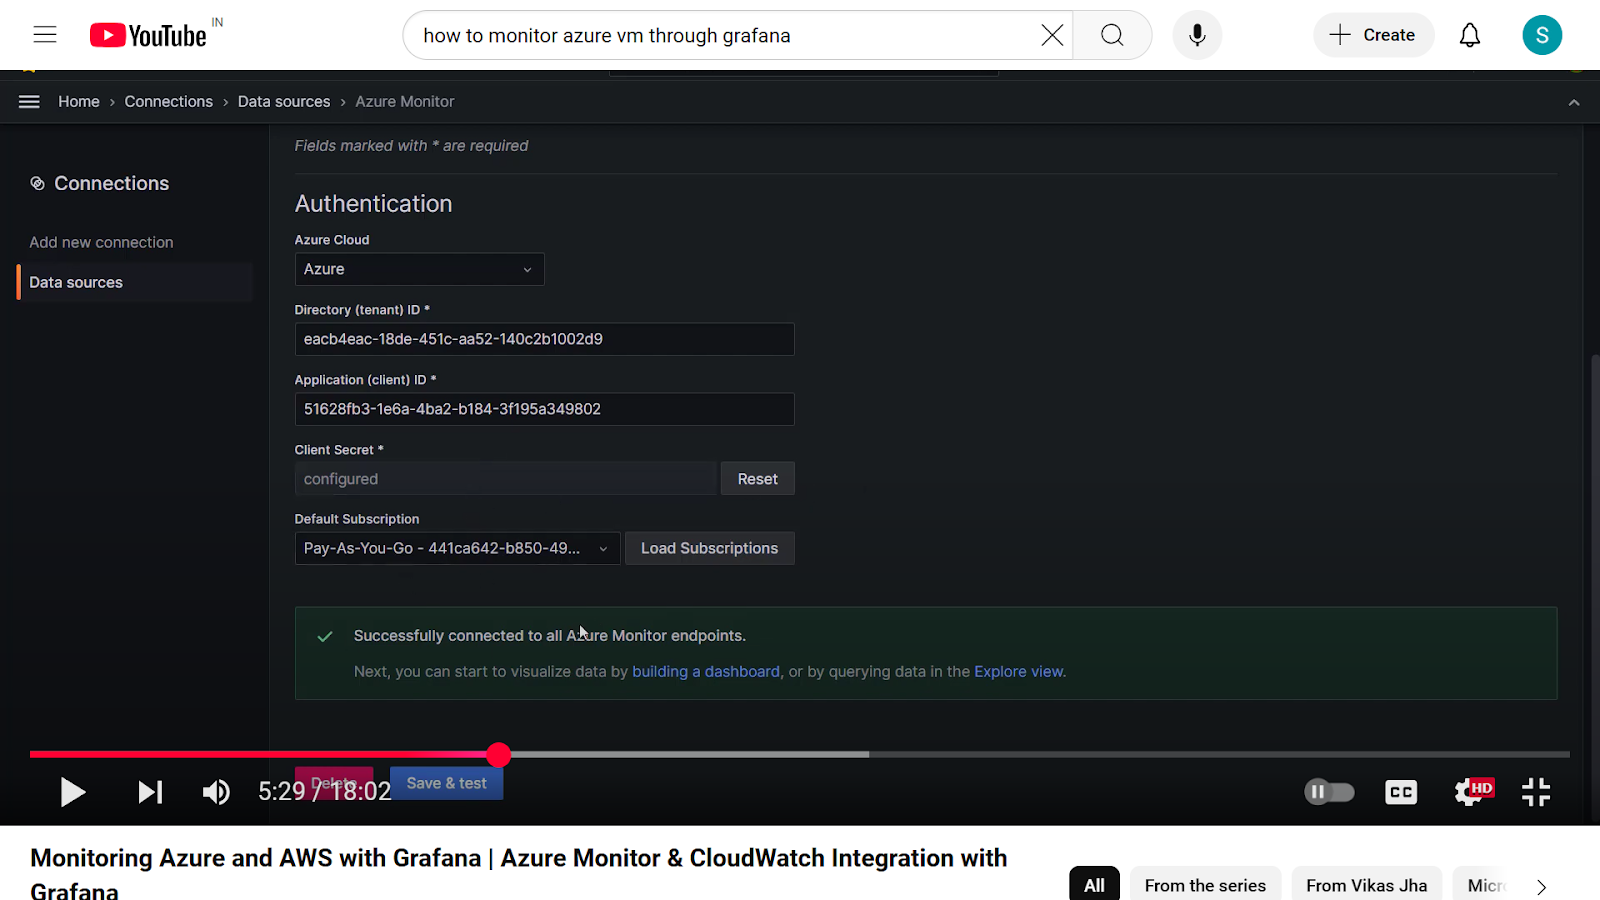
add new data source-> It will show authentication in which you need Tenant id, application id, and client secret.
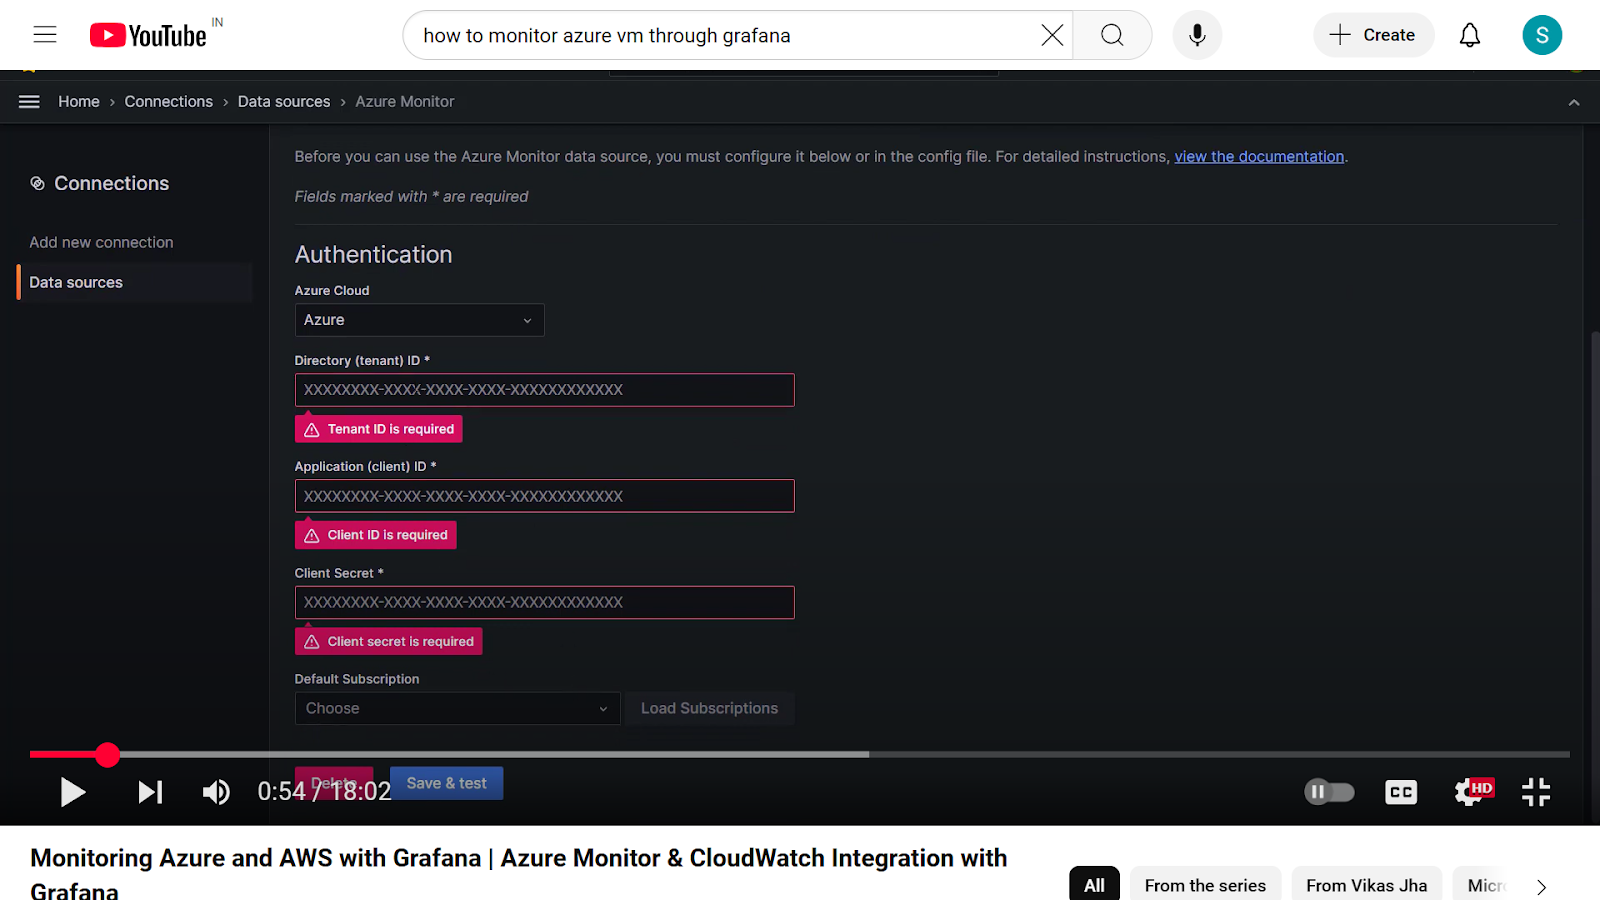
So we need to create this above ids
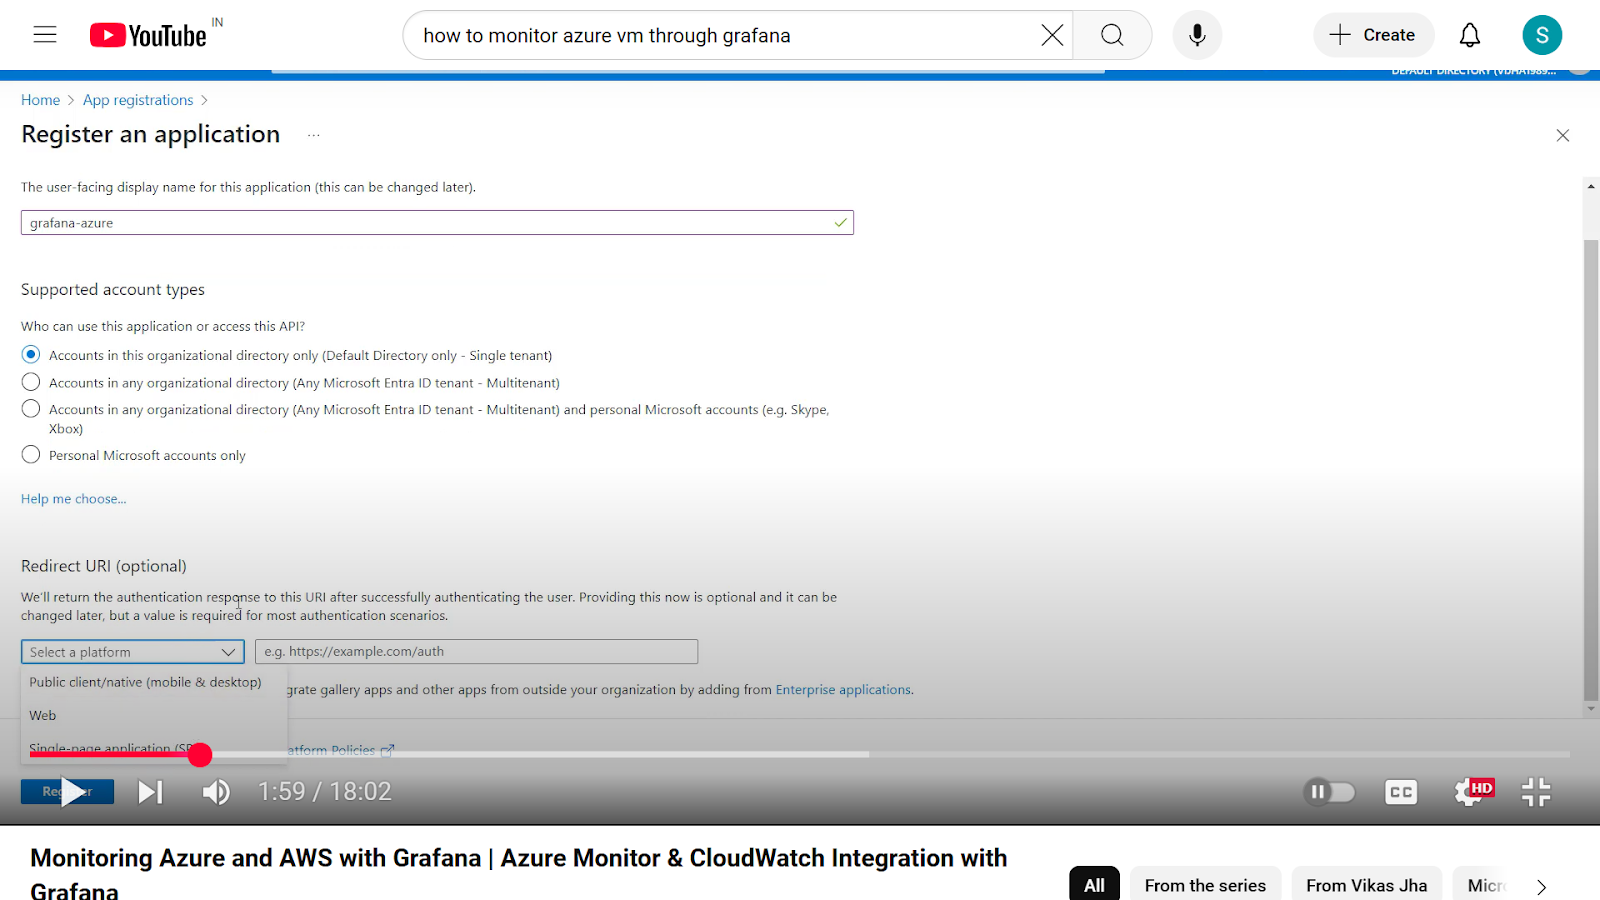
Go to azure portal-> app registration-> create new new registration for new application->give name”Grafana-azure”-> Register.
For client secret-> add certificate-> new client secret-> description as “Grafana-azure-secret-> add.
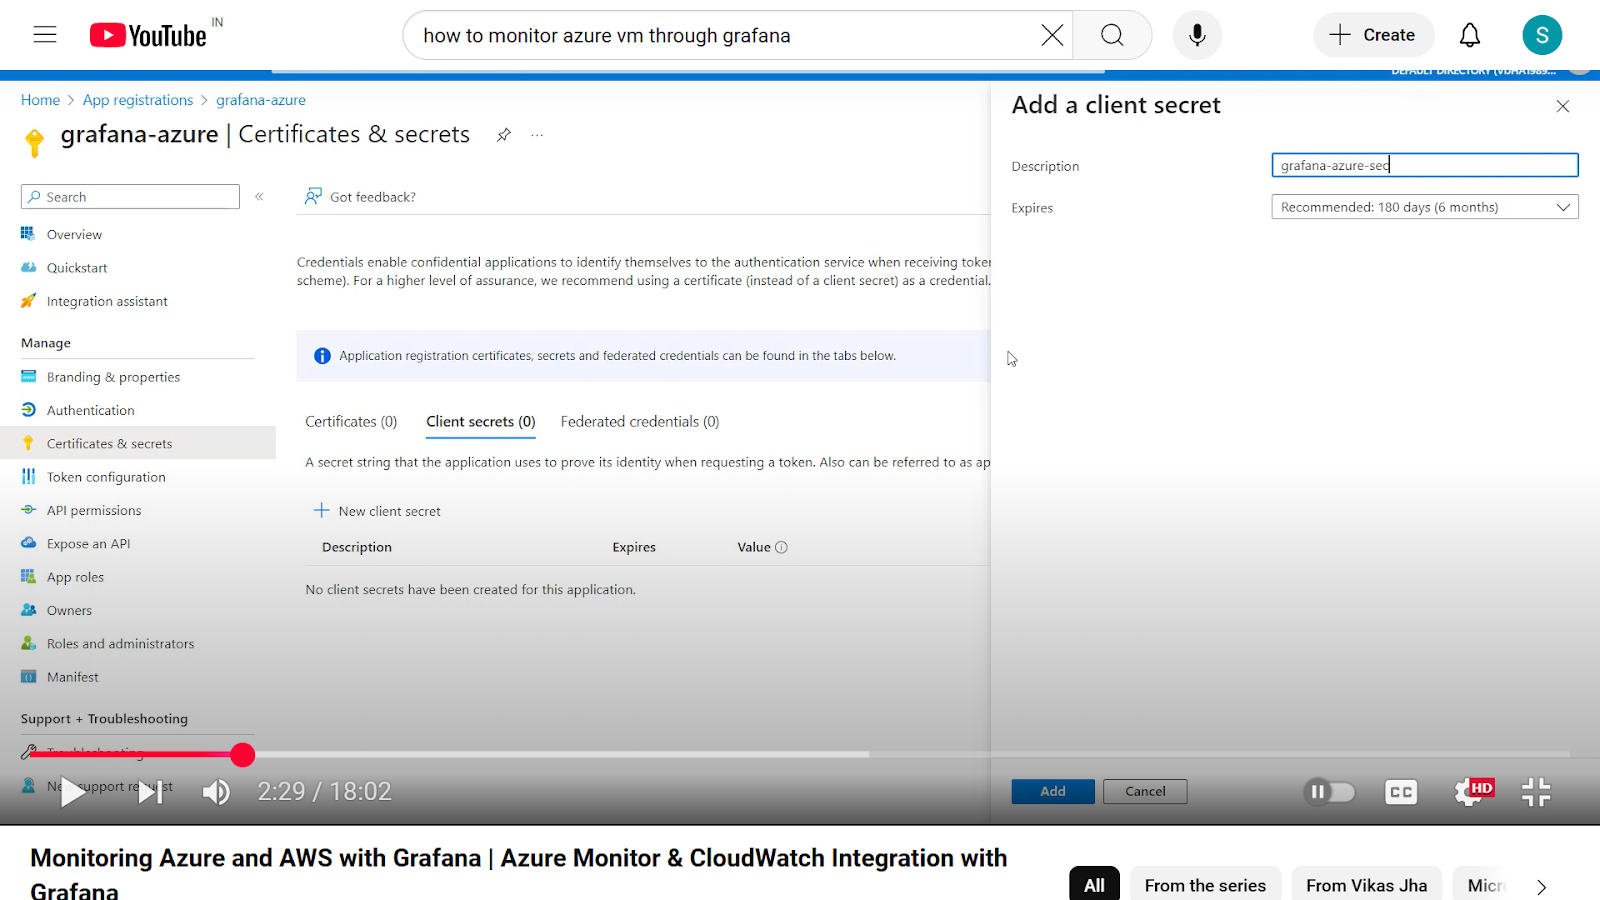
Check API permission is it for read
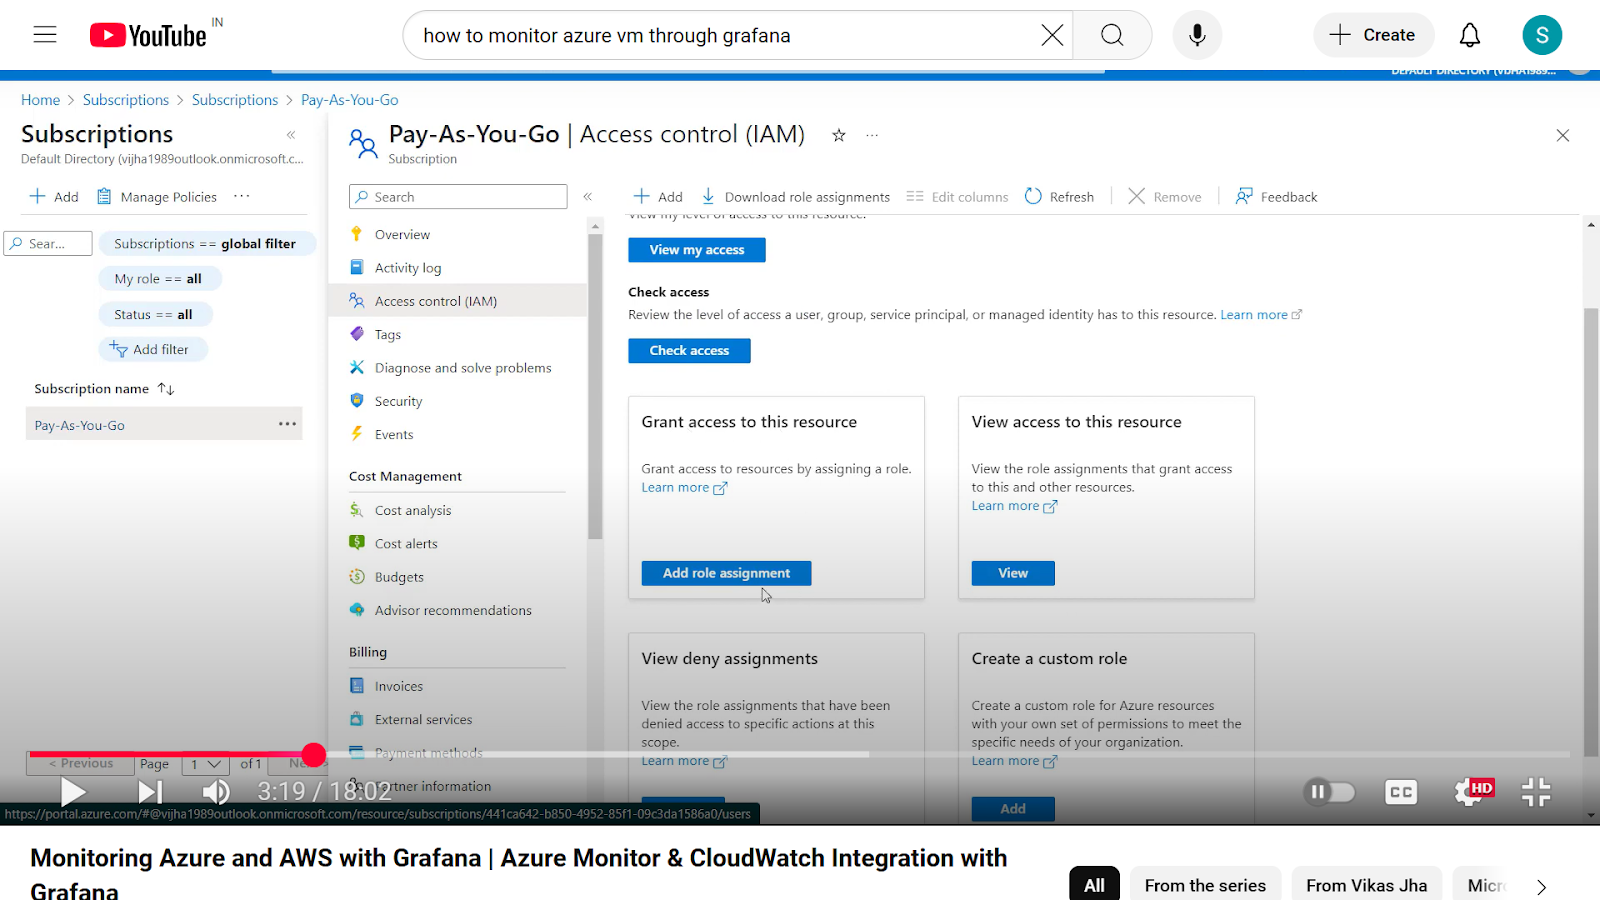
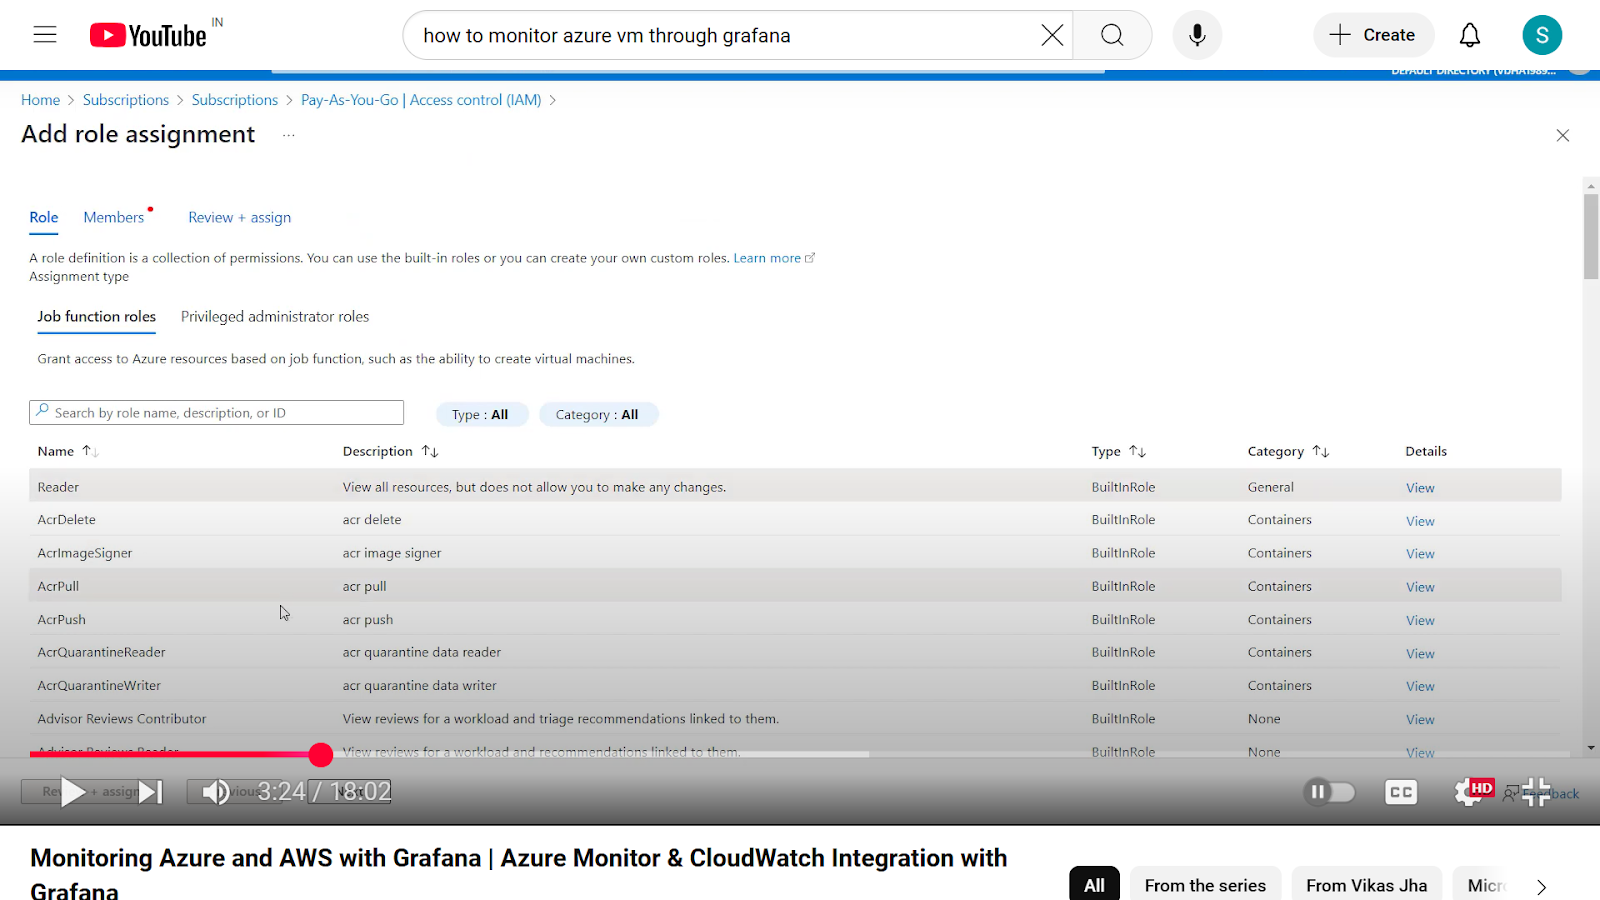
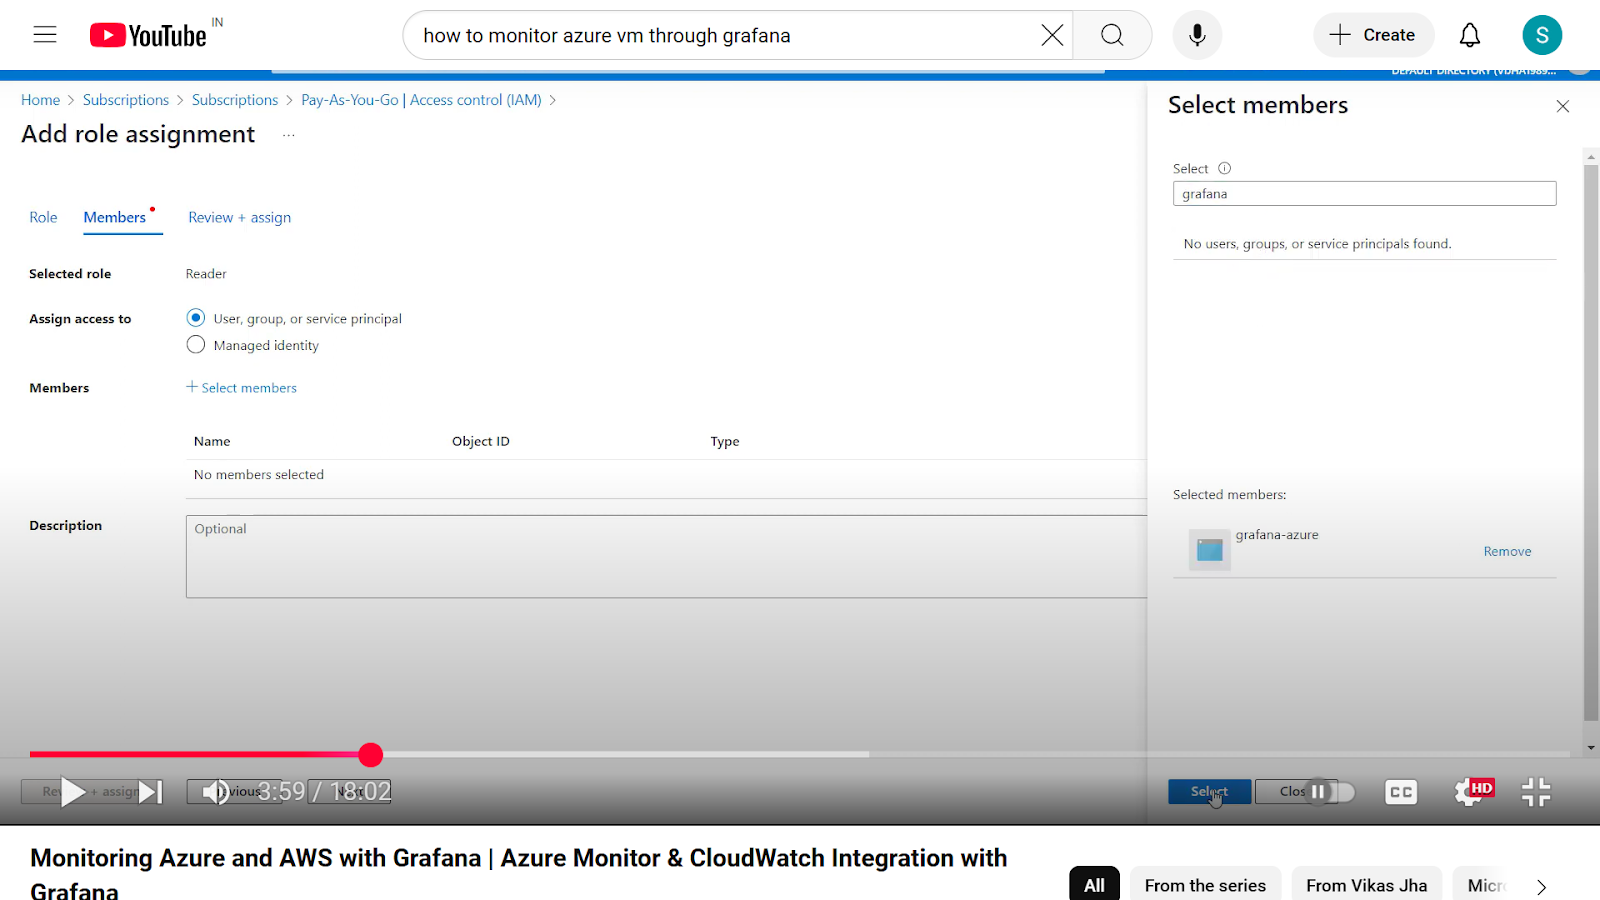
Then Go to subscription-> select subscription-> click on access control(IAM)-> In grant access to resource-> add role assignment-> Give reader access-> next-> assign access (user, group or service principal)-> add member-> select application “Grafana-azure” that already created-> select-> review and assign.
Got to app registration again and Then can see id’s -> copied id’s and paste it into the grafana authentication page.
Load subscription-> save & test ->once show successfully connected message.
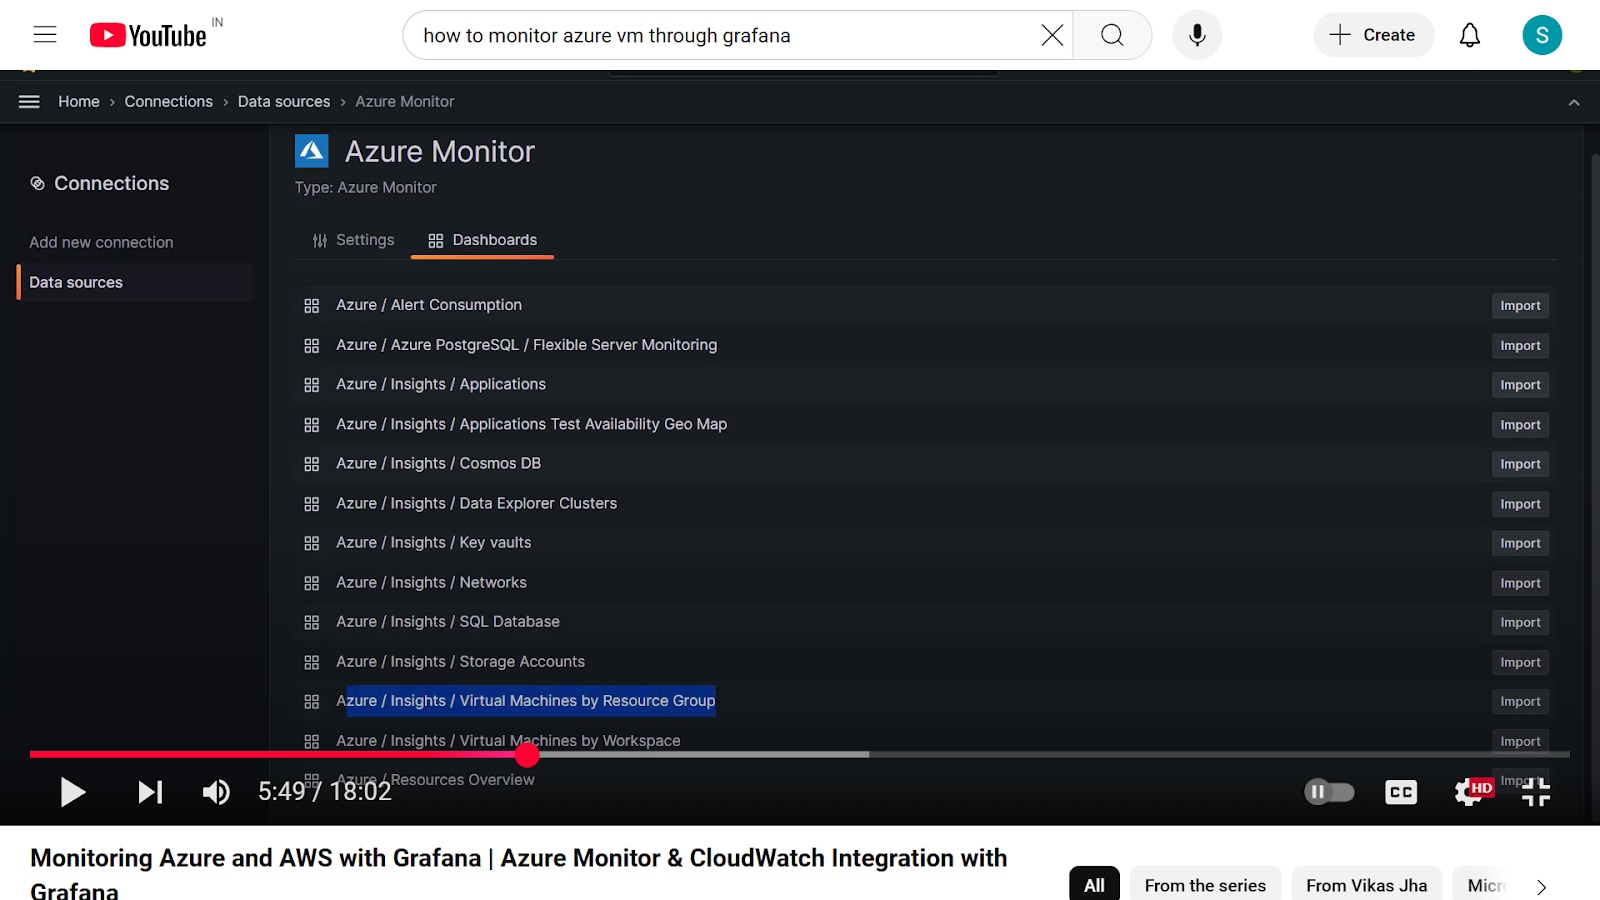
Then go to dashboard-> create dashboard-> azure monitor data source-> click on “azure/insights/virtual machine by resource group”-> import-> click on it.
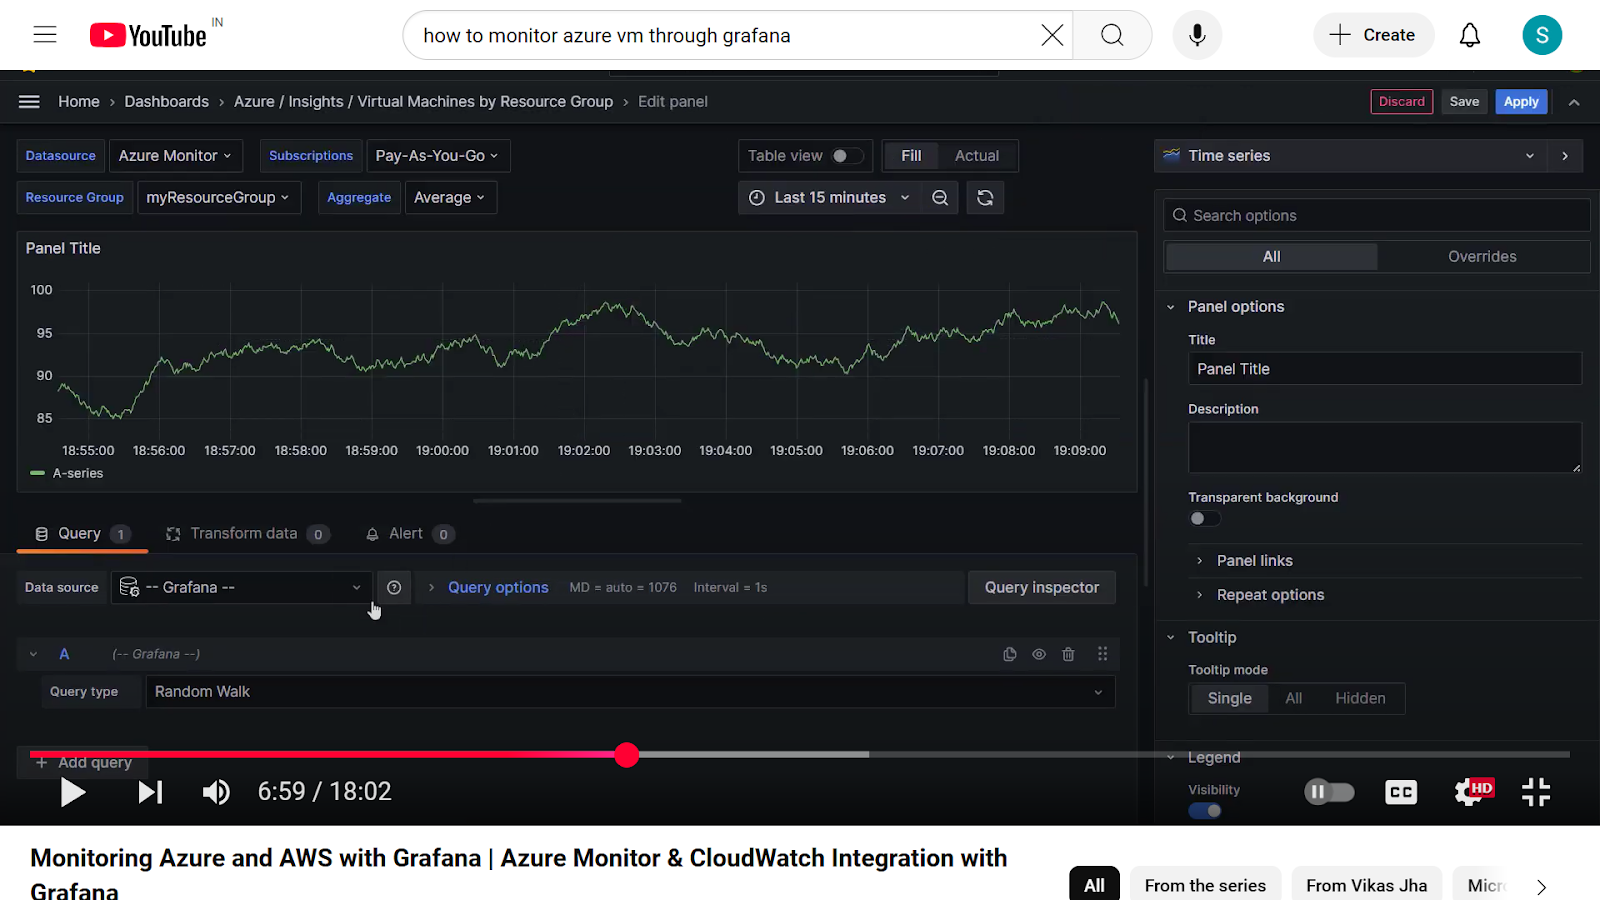
Able to see dashboard-> select datasource, subscription, resource group etc.
If we select visualization as per our so we have to select data source as azure monitor-> select resource-> apply.
In metrics select as per like CPU or network I/O or else.
We can also download custom dashboard according to need.